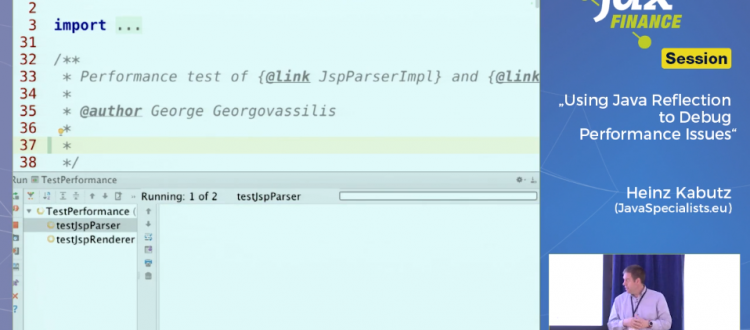
In this talk, Dr. Heinz Kabuz shows how to find performance bottlenecks in Java using a profiler, as well as how to check if the profiler has found the mother lode by looking at the objects with reflection. In the first example provided, an open source tool that exhibited CPU bound performance issues is profiled. A typical bad coding paradigm is discovered, and Java reflection is used to test whether this bottleneck could be eliminated with a better hashing mechanism.
The second example provides an insight at the new Java 8 hash function inside HashMap. Debuggers hide the gory details of a HashMap from prying eyes, so reflection is used to output the contents of the array of buckets. This shows essential data about the effects of the new hash function. Java 8 HashMaps can perform 3x slower than previous versions! Using reflection, one can show why that is.
This talk is mostly live coding, with a few slides explaining how to find performance bottlenecks quickly.
JAX Finance 2016: Using Java Reflection to Debug Performance Issues from JAX TV on Vimeo.